The Insafe network of helplines collects data about the types of calls received and this is analysed every three months to look at possible trends and emerging issues.

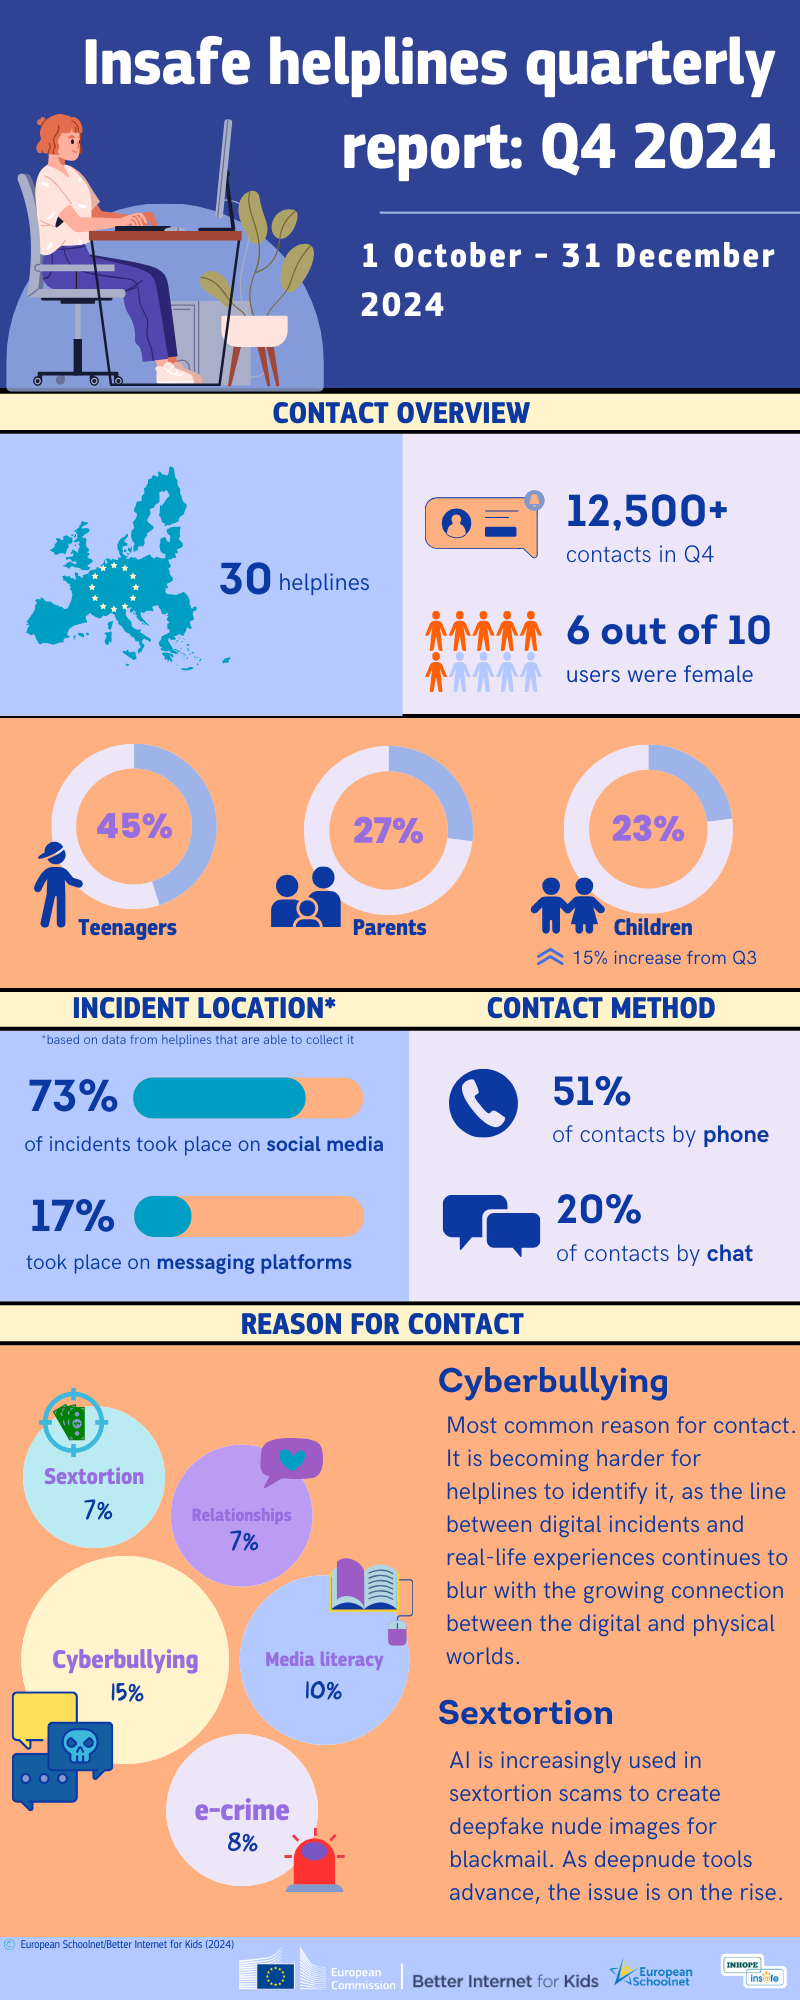
The most recent helpline data covers the period from October to December 2024. There were over 12,500 contacts made to the network which is a slight reduction on the previous reporting period.
43 per cent of contacts came from individuals identifying as male with 45 per cent from teens (12-18 years old) and 23 per cent from 5–12-year-olds, which represents an increase of 15 percentage points when compared to the previous reporting period.
Despite the growing numbers of children and young people who have access to smartphones and other devices, the most common way to contact a helpline continues to be via a phone call with just over half of all contacts made this way. 20 per cent of contacts were via chat during this reporting period but some helplines reported having had problems with their chat systems which will have had an impact on figures.
Helplines are asked (where possible) to capture data related to where a particular issue or problem occurred. Around half of the helplines are able to collect this data and during this reporting period 73 per cent of cases that could be attributed to a particular type of platform took place on social media sites. Starting in Q4 of 2024, helplines also started to identify the specific platforms where harm occurred where they are able to do so and just over 70 per cent of the cases that took place on a social media platform which could be attributed to a specific site took place on Facebook or Instagram.
Cyberbullying continues to be the most common reason for reaching out to a helpline with 15 per cent of all contacts relating to this issue, a rise of three percentage points on the previous quarter.
Previous reporting periods have seen rises in contacts relating to e-crime but Q4 saw a significant reduction of four percentage points. Excessive use and gaming have both risen by one percentage point, and some helplines have suggested that this can be something which more parents become aware of at the outset of the new school year, where some young people find it difficult to manage the balance between their tech use, and in particular online games, and schoolwork.
Data shows that there has been a reduction of two percentage points in the online sexual coercion and extortion of children (sometimes referred to as sextortion). However, the actual number of contacts relating to this has increased since the previous reporting period, with several helplines commenting on the rise that they are seeing. Additionally, some made specific reference to the growth in the creation of deepfake nude content, which is being used in sextortion cases.
Insafe contacts are now grouped into four main areas:
- Being online (incorporating advertising and commercialism, data privacy, fake news, media literacy/education, potentially harmful content, self-harm, suicide and technical settings). This area accounted for 36 per cent of all contacts.
- Online violence (incorporating cyberbullying, e-crime, hate speech and radicalisation/terrorism) and this accounted for 25 per cent of all contacts which is unchanged since Q3.
- Online activities/relations (incorporating excessive use, gaming, love, relationships, sexuality (online) online reputation and pornography) which accounted for 23 per cent of all calls, the same as in the previous quarter.
- Online sexual abuse and violence (incorporating grooming, the non-consensual sharing of intimate images (NCSII) and the online sexual coercion and extortion of minors (which used to be referred to as sextortion)). This area accounted for 16 per cent of all contacts made, a reduction of one percentage point on the last report.
The table below shows the percentage of contacts assigned to each category.
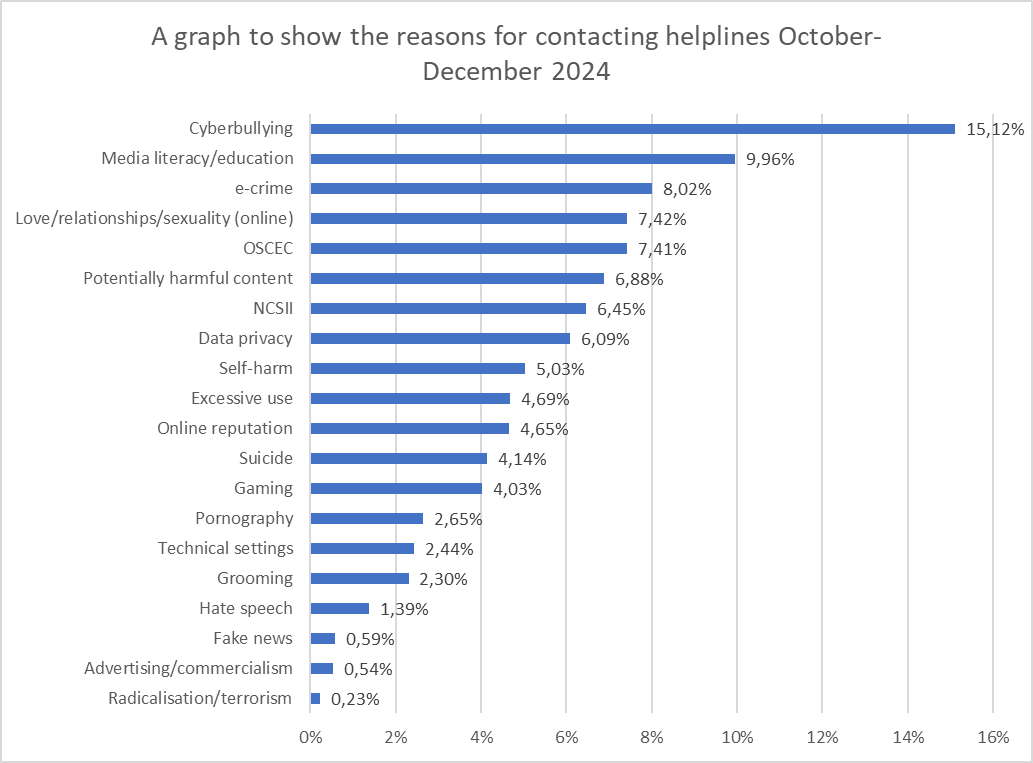
| Reason for contacting the helpline | Percentage |
| Radicalisation/terrorism | 0.23% |
| Advertising/commercialism | 0.54% |
| Fake news | 0.59% |
| Hate Speech | 1.39% |
| Grooming | 2.30% |
| Technical settings | 2.44% |
| Pornography | 2.65% |
| Gaming | 4.03% |
| Suicide | 4.14% |
| Online reputation | 4.65% |
| Excessive use | 4.69% |
| Self-harm | 5.03% |
| Data privacy | 6.09% |
| NCSII | 6.45% |
| Potentially harmful content | 6.88% |
| Online sexual coercion and extortion of children (sextortion) | 7.41% |
| Love/relationships/sexuality (online) | 7.42% |
| e-crime | 8.02% |
| Media literacy/education | 9.96% |
| Cyberbullying | 15.12% |
The infographic below provides a visual representation of many of the key points in the fourth quarter of 2024, all in the text above, from October to December.
Find out more about country-based helpline services, operating as part of the national Safer Internet Centre and keep up to date with news on helpline services and trends.


The Insafe network of helplines collects data about the types of calls received and this is analysed every three months to look at possible trends and emerging issues.
The most recent helpline data covers the period from October to December 2024. There were over 12,500 contacts made to the network which is a slight reduction on the previous reporting period.
43 per cent of contacts came from individuals identifying as male with 45 per cent from teens (12-18 years old) and 23 per cent from 5–12-year-olds, which represents an increase of 15 percentage points when compared to the previous reporting period.
Despite the growing numbers of children and young people who have access to smartphones and other devices, the most common way to contact a helpline continues to be via a phone call with just over half of all contacts made this way. 20 per cent of contacts were via chat during this reporting period but some helplines reported having had problems with their chat systems which will have had an impact on figures.
Helplines are asked (where possible) to capture data related to where a particular issue or problem occurred. Around half of the helplines are able to collect this data and during this reporting period 73 per cent of cases that could be attributed to a particular type of platform took place on social media sites. Starting in Q4 of 2024, helplines also started to identify the specific platforms where harm occurred where they are able to do so and just over 70 per cent of the cases that took place on a social media platform which could be attributed to a specific site took place on Facebook or Instagram.
Cyberbullying continues to be the most common reason for reaching out to a helpline with 15 per cent of all contacts relating to this issue, a rise of three percentage points on the previous quarter.
Previous reporting periods have seen rises in contacts relating to e-crime but Q4 saw a significant reduction of four percentage points. Excessive use and gaming have both risen by one percentage point, and some helplines have suggested that this can be something which more parents become aware of at the outset of the new school year, where some young people find it difficult to manage the balance between their tech use, and in particular online games, and schoolwork.
Data shows that there has been a reduction of two percentage points in the online sexual coercion and extortion of children (sometimes referred to as sextortion). However, the actual number of contacts relating to this has increased since the previous reporting period, with several helplines commenting on the rise that they are seeing. Additionally, some made specific reference to the growth in the creation of deepfake nude content, which is being used in sextortion cases.
Insafe contacts are now grouped into four main areas:
- Being online (incorporating advertising and commercialism, data privacy, fake news, media literacy/education, potentially harmful content, self-harm, suicide and technical settings). This area accounted for 36 per cent of all contacts.
- Online violence (incorporating cyberbullying, e-crime, hate speech and radicalisation/terrorism) and this accounted for 25 per cent of all contacts which is unchanged since Q3.
- Online activities/relations (incorporating excessive use, gaming, love, relationships, sexuality (online) online reputation and pornography) which accounted for 23 per cent of all calls, the same as in the previous quarter.
- Online sexual abuse and violence (incorporating grooming, the non-consensual sharing of intimate images (NCSII) and the online sexual coercion and extortion of minors (which used to be referred to as sextortion)). This area accounted for 16 per cent of all contacts made, a reduction of one percentage point on the last report.
The table below shows the percentage of contacts assigned to each category.
| Reason for contacting the helpline | Percentage |
| Radicalisation/terrorism | 0.23% |
| Advertising/commercialism | 0.54% |
| Fake news | 0.59% |
| Hate Speech | 1.39% |
| Grooming | 2.30% |
| Technical settings | 2.44% |
| Pornography | 2.65% |
| Gaming | 4.03% |
| Suicide | 4.14% |
| Online reputation | 4.65% |
| Excessive use | 4.69% |
| Self-harm | 5.03% |
| Data privacy | 6.09% |
| NCSII | 6.45% |
| Potentially harmful content | 6.88% |
| Online sexual coercion and extortion of children (sextortion) | 7.41% |
| Love/relationships/sexuality (online) | 7.42% |
| e-crime | 8.02% |
| Media literacy/education | 9.96% |
| Cyberbullying | 15.12% |
The infographic below provides a visual representation of many of the key points in the fourth quarter of 2024, all in the text above, from October to December.
Find out more about country-based helpline services, operating as part of the national Safer Internet Centre and keep up to date with news on helpline services and trends.
- helplines cyberbullying Safer Internet Centre (SIC)
Related content
- < Previous article
- Next article >
- < Previous
- Next >
Related articles


