The Insafe network of helplines collects data about the types of calls they receive and this is analysed every three months in order to look at possible trends and emerging issues.

The most recent helpline data covers the period from July to September 2024. There were over 13,000 contacts made to the network which is a slight reduction on the previous reporting period, however during July, August and early September, many children in Europe are on holiday and some helplines typically expect the volume of contacts to be lower.
58 per cent of contacts come from teens (12–18-year-olds) with 8 per cent from the younger children (5–11-year-olds). These percentages remain fairly consistent from one reporting period to another, but helplines have reported a reduction in the number of contacts from parents with 28 per cent of contacts from them during this quarter, a reduction of seven percentage points.
The most common way to contact a helpline continues to be by phone with just over half of all contacts being made in this way. A growing number are using chat, 29 per cent of contacts during this quarter and more helplines are exploring this as a method of communication.
Helplines are asked (where possible) to capture data related to where a particular issue or problem occurred. Exactly half of the helplines are able to collect this data, and so far in 2024 around ¾ of the issues have taken place on social media. During this reporting period there has been quite an increase (nine per centage points) in issues taking place on messaging services with 25 per cent happening in these spaces.
Cyberbullying continues to be the most common reason for reaching out to a helpline but as mentioned in the previous report contacts relating to e-crime continue to increase and both of these categories account for 12 per cent of contacts.
Contacts related to e-crime and NCSII (the non-consensual sharing of intimate images) both rose by two percentage points compared to Q2 and contacts related to the online sexual coercion and exploitation of children (sextortion) rose by one percentage point and now accounts for nine percent of all contacts to the network.
Insafe contacts are now grouped into four main areas:
- Being online (incorporating advertising and commercialism, data privacy, fake news, media literacy/education, potentially harmful content, self-harm, suicide and technical settings). This area accounted for 35 per cent of all contacts.
- Online violence (incorporating cyberbullying, e-crime, hate speech and radicalisation/terrorism) and this accounted for 25 per cent of all contacts. There has been an increase in contacts relating to these issues for the last three reporting periods.
- Online activities/relations (incorporating excessive use, gaming, love, relationships, sexuality (online) online reputation and pornography) which accounted for 23 per cent of all calls. This was a reduction on the previous reporting period and is now five per cent lower than in Q4 of 2023.
- Online sexual abuse and violence (incorporating grooming, the non-consensual sharing of intimate images (NCSII) and the online sexual coercion and extortion of minors (which used to be referred to as sextortion). This area accounted for 17 per cent of all contacts made, an increase of two percentage points on the last report.
The table shows the percentage of contacts assigned to each category.
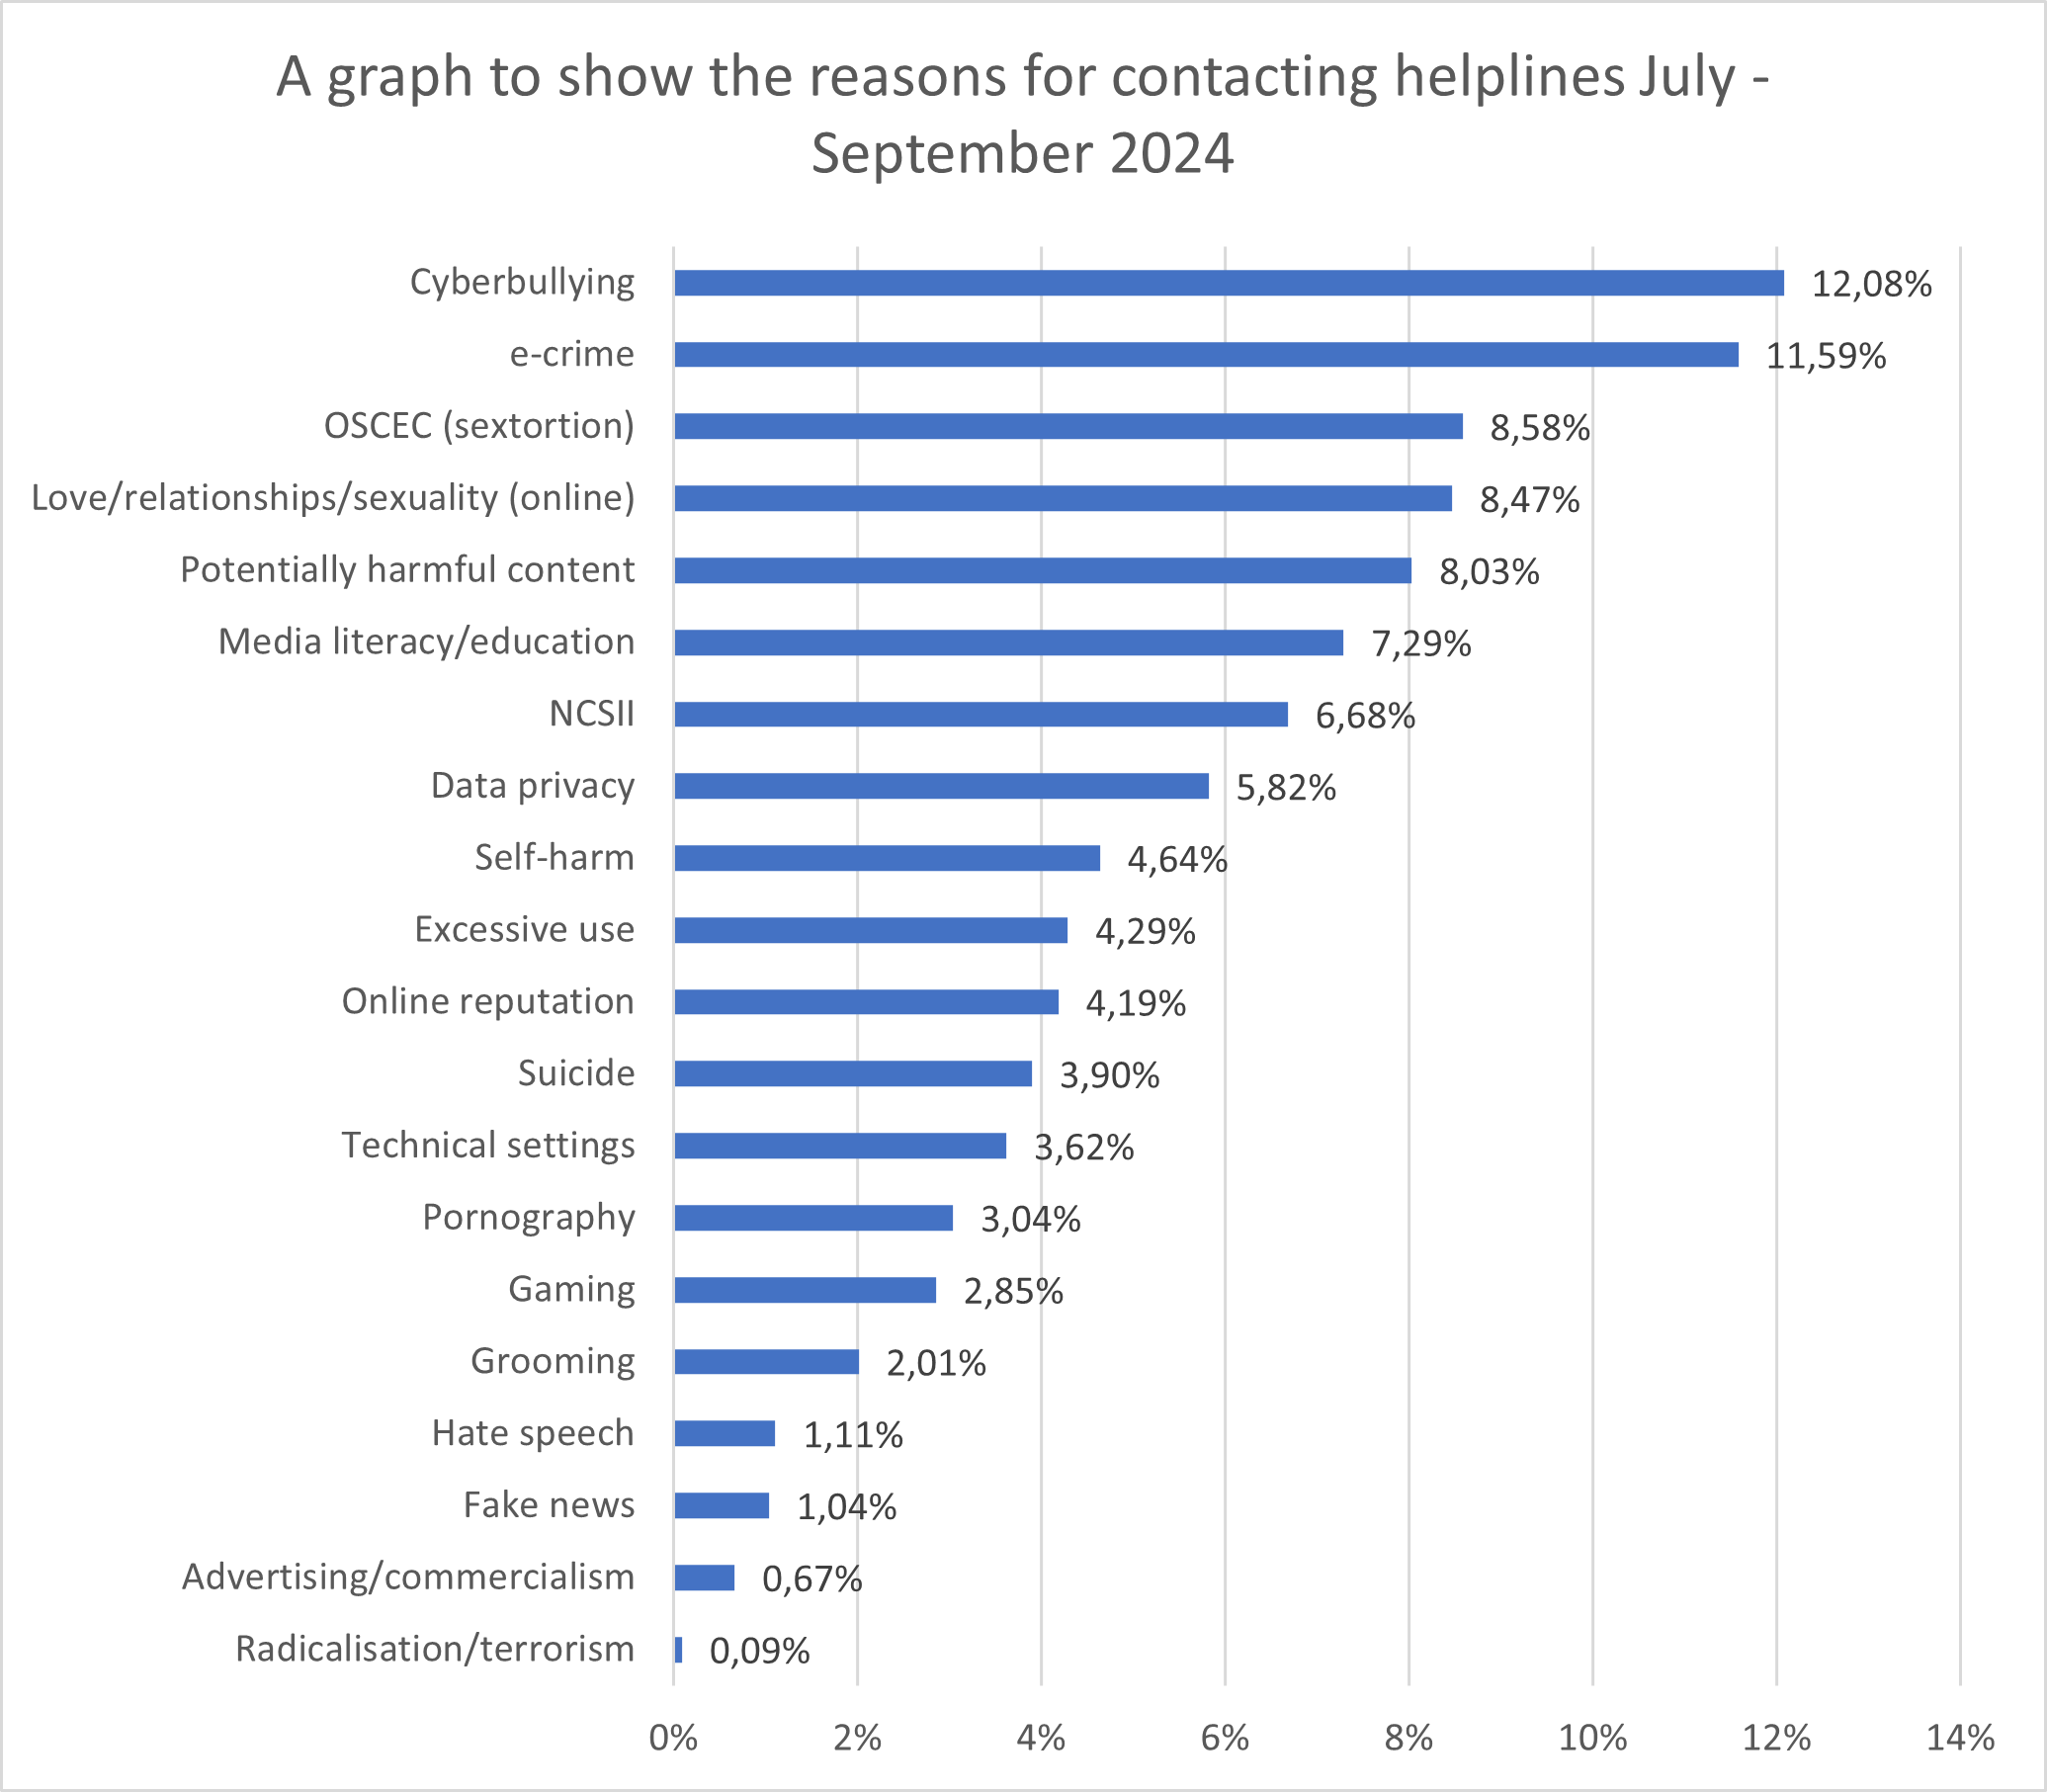
| Reason for contacting the helpline | Percentage |
|---|---|
| Radicalisation/terrorism | 0.09 per cent |
| Advertising/commercialism | 0.67 per cent |
| Fake news | 1.04 per cent |
| Hate speech | 1.11 per cent |
| Grooming | 2.01 per cent |
| Gaming | 2.85 per cent |
| Pornography | 3.04 per cent |
| Technical settings | 3.62 per cent |
| Suicide | 3.9 per cent |
| Online reputation | 4.19 per cent |
| Excessive use | 4.29 per cent |
| Self-harm | 4.64 per cent |
| Data privacy | 5.82 per cent |
| NCSII | 6.68 per cent |
| Media literacy/education | 7.29 per cent |
| Potentially harmful content | 8.03 per cent |
| Love/relationships/sexuality (online) | 8.47 per cent |
| Online sexual coercion and extortion of children (sextortion) | 8.58 per cent |
| e-crime | 11.59 per cent |
| Cyberbullying | 12.08 per cent |
The infographic provides a visual representation of many of the key points in the third quarter of 2024, all in the text above, from July to September.

Find out more about country-based helpline services, operating as part of the national Safer Internet Centre and keep up to date with news on helpline services and trends.


The Insafe network of helplines collects data about the types of calls they receive and this is analysed every three months in order to look at possible trends and emerging issues.
The most recent helpline data covers the period from July to September 2024. There were over 13,000 contacts made to the network which is a slight reduction on the previous reporting period, however during July, August and early September, many children in Europe are on holiday and some helplines typically expect the volume of contacts to be lower.
58 per cent of contacts come from teens (12–18-year-olds) with 8 per cent from the younger children (5–11-year-olds). These percentages remain fairly consistent from one reporting period to another, but helplines have reported a reduction in the number of contacts from parents with 28 per cent of contacts from them during this quarter, a reduction of seven percentage points.
The most common way to contact a helpline continues to be by phone with just over half of all contacts being made in this way. A growing number are using chat, 29 per cent of contacts during this quarter and more helplines are exploring this as a method of communication.
Helplines are asked (where possible) to capture data related to where a particular issue or problem occurred. Exactly half of the helplines are able to collect this data, and so far in 2024 around ¾ of the issues have taken place on social media. During this reporting period there has been quite an increase (nine per centage points) in issues taking place on messaging services with 25 per cent happening in these spaces.
Cyberbullying continues to be the most common reason for reaching out to a helpline but as mentioned in the previous report contacts relating to e-crime continue to increase and both of these categories account for 12 per cent of contacts.
Contacts related to e-crime and NCSII (the non-consensual sharing of intimate images) both rose by two percentage points compared to Q2 and contacts related to the online sexual coercion and exploitation of children (sextortion) rose by one percentage point and now accounts for nine percent of all contacts to the network.
Insafe contacts are now grouped into four main areas:
- Being online (incorporating advertising and commercialism, data privacy, fake news, media literacy/education, potentially harmful content, self-harm, suicide and technical settings). This area accounted for 35 per cent of all contacts.
- Online violence (incorporating cyberbullying, e-crime, hate speech and radicalisation/terrorism) and this accounted for 25 per cent of all contacts. There has been an increase in contacts relating to these issues for the last three reporting periods.
- Online activities/relations (incorporating excessive use, gaming, love, relationships, sexuality (online) online reputation and pornography) which accounted for 23 per cent of all calls. This was a reduction on the previous reporting period and is now five per cent lower than in Q4 of 2023.
- Online sexual abuse and violence (incorporating grooming, the non-consensual sharing of intimate images (NCSII) and the online sexual coercion and extortion of minors (which used to be referred to as sextortion). This area accounted for 17 per cent of all contacts made, an increase of two percentage points on the last report.
The table shows the percentage of contacts assigned to each category.
| Reason for contacting the helpline | Percentage |
|---|---|
| Radicalisation/terrorism | 0.09 per cent |
| Advertising/commercialism | 0.67 per cent |
| Fake news | 1.04 per cent |
| Hate speech | 1.11 per cent |
| Grooming | 2.01 per cent |
| Gaming | 2.85 per cent |
| Pornography | 3.04 per cent |
| Technical settings | 3.62 per cent |
| Suicide | 3.9 per cent |
| Online reputation | 4.19 per cent |
| Excessive use | 4.29 per cent |
| Self-harm | 4.64 per cent |
| Data privacy | 5.82 per cent |
| NCSII | 6.68 per cent |
| Media literacy/education | 7.29 per cent |
| Potentially harmful content | 8.03 per cent |
| Love/relationships/sexuality (online) | 8.47 per cent |
| Online sexual coercion and extortion of children (sextortion) | 8.58 per cent |
| e-crime | 11.59 per cent |
| Cyberbullying | 12.08 per cent |
The infographic provides a visual representation of many of the key points in the third quarter of 2024, all in the text above, from July to September.
Find out more about country-based helpline services, operating as part of the national Safer Internet Centre and keep up to date with news on helpline services and trends.
- digital literacy helplines well-being
Related content
- < Previous article
- Next article >
- < Previous
- Next >
Related articles


